The report on new home sales from the United States Commerce Department on 24 August shows that the US housing market continued to weaken in July. This has negative implications for the economy. Does it have negative implications for the stock market as well?
Economists generally accept that the trend in new home sales is a leading indicator for the economy as a whole, so the 4.3 percent fall in new home sales in July does not bode well for the economy. The fall is also in line with the recent deterioration in the National Association of Home Builders-Wells Fargo Housing Market Index (HMI).
The stock market, another leading indicator for the economy, is, despite its rebound over the past few months, also off its high for the year. So it also telling the same story of a weakening economy.
The question that stock investors would have is: Does the recent weakness in the housing market indicate impending weakness in the stock market?
Both markets are affected by interest rates. Both markets are leading indicators of the economy. Is one market also a leading indicator of the other?
In an article for TheStreet.com published on 21 August, Doug Kass of Seabreeze Partners produced a chart that showed that "when the index of homebuilders drops, a broader decline in the major indices is not far behind". Specifically, his chart implies that the Standard & Poor's 500 Index lags the HMI by 12 months. I have more or less reproduced his chart below.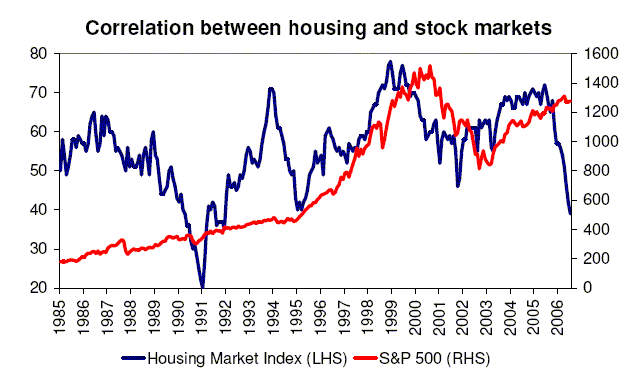 John Mauldin, president of Millennium Wave Advisors, also wrote about this correlation recently in his newsletter Thoughts from the Frontline, quoting Merrill Lynch economist David Rosenberg as saying that "the NAHB homebuilders index leads the S&P 500 by 12 months and with a near-80% correlation - a correlation that over time has actually strengthened, owing to the growing influence that the real estate market has exerted on the overall economic and financial landscape over the past five years".
From the chart above, you can see why Rosenberg says the correlation has strengthened. From around the late 1990s onwards, the S&P 500 has indeed followed the HMI with a lag of about a year. However, the chart also shows that in the late 1980s and early 1990s, the stock market appeared to ignore the housing market, the S&P 500 rising steadily almost regardless of what the HMI was doing.
Part of the problem, though, is the fact that while the HMI is a variable that fluctuates between 0 and 100, the S&P 500 is one that tends to rise over time. For such cases, comparing year-on-year changes probably makes the relationship clearer. This is done in the next chart.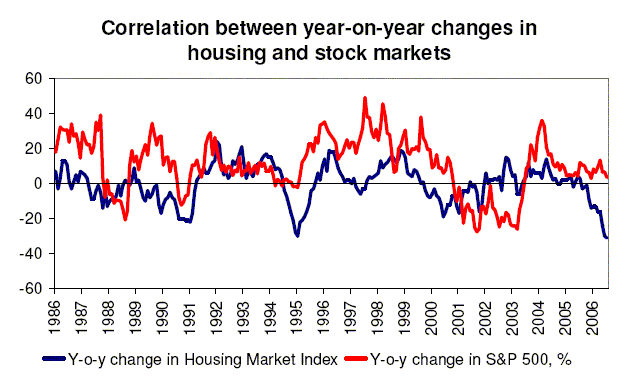 This chart shows that the stock market did not completely ignore the housing market in the earlier period. Whenever the HMI fell, the rate of change of the S&P 500 did tend to fall, even when the index itself did not fall.
The other matter is the lag in the S&P 500 relative to the HMI. The second chart still shows that the S&P 500 lagged the HMI from the late 1990s onwards -- and by even more than 12 months -- but in the late 1980s and early 1990s, there is little apparent consistent lag.
The question of whether there is a lag is an important one, of course, because if there is a lag, then the stock market is likely to fall over the next few months based on the recent decline in the HMI. On the other hand, if the lag seen in recent times turns out to be a temporary phenomenon and the S&P 500 reverts to a more coincident relationship with the HMI, then the recent decline in the latter could already have been discounted and provides no indication of the likely direction of the stock market.
Unfortunately, this is a question that I do not have the answer for. However, lag or no lag, the extent of the decline in the housing market alone should probably be enough to warrant caution for those planning to invest in the stock market in the near future.
Update on 11 January 2007: Eighth paragraph -- "early 1980s" changed to read "early 1990s".

2 comments:
Very nice charts and analysis. What's the R sqr in the 2nd chart?
If you assume a one-month lag (optimal), the R sqr is 0.08.
Post a Comment