Stock markets fell last week, with several markets closing at multi-year lows last Friday and threatening a renewal of the downtrend seen in 2008.
After falling dramatically for much of 2008, most stock markets had seemingly found a bottom around October or November and been moving sideways since then. This had provided hope to investors that stocks might be forming a bottom.
However, last week, several major stock market indices broke the sideways pattern to the downside, putting hopes that they have found a bottom under serious threat. In the United States, the Dow Jones Industrial Average fell 6.2 percent last week to close at 7,365.67 on Friday, its lowest close in six years. In Europe, the Dow Jones Stoxx 600 Index fell 7.5 percent to close at 176.93, its lowest close in almost six years. In Japan, the Topix fell 1.6 percent to 739.53, its lowest close in 25 years.
The breakdown in these indices occurred at a time when it was becoming obvious to investors that the global economic downturn accelerated at the end of 2008 and is likely to get worse before it gets better.
According to a report from the Organisation for Economic Co-operation and Development on 18 February, gross domestic product in the countries belonging to the group fell by 1.5 percent in the fourth quarter of 2008, the largest fall since OECD records began in 1960. Deterioration was seen in almost all the member countries for which data was available on that date, including in the United States, the euro area and Japan.
| Quarterly percentage change in real GDP | ||
|---|---|---|
| 2008 | ||
| Q3 | Q4 | |
| OECD - Total | -0.2 | -1.5 |
| United States | -0.1 | -1.0 |
| Euro area | -0.2 | -1.5 |
| Japan | -0.6 | -3.3 |
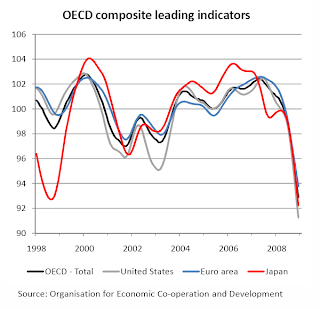
 The contraction in the OECD economies will almost certainly persist in at least early 2009. An earlier report from the OECD showed that the composite leading indicator for the group had fallen by 1.1 point in December, not much better than the rate of decline in the previous three months. Indeed, the accompanying chart shows that the composite leading indicators for the OECD as a whole and the major economies have been plunging since around the middle of 2008. According to the OECD, the composite leading indicators in most OECD countries have fallen to levels that were last seen during the oil shocks of the 1970s.
 Other data mostly corroborate the tough outlook ahead.
A report from the Economic and Social Research Institute last week showed that its composite leading index for Japan continued to plunge at the end of last year. It fell to 80.0 in December from 81.8 in November.
In Europe, a composite index of business activity based on a survey of purchasing managers by Markit Economics fell to 36.2 in February, a record low, from 38.3 in January, based on a preliminary estimate. The manufacturing index fell to 33.6 in February from 34.4 in January while the services index fell to 38.9 from 42.2, both falling to the lowest on record.
The Conference Board's leading index for the US economy, though, did register an increase in January of 0.4 percent. However, over the past six months, the index was down 1.9 percent.
Of course, the stock market itself is a leading indicator of the economy, and if recent market movements are any indication, investors may be bracing themselves for more economic weakness ahead.

No comments:
Post a Comment